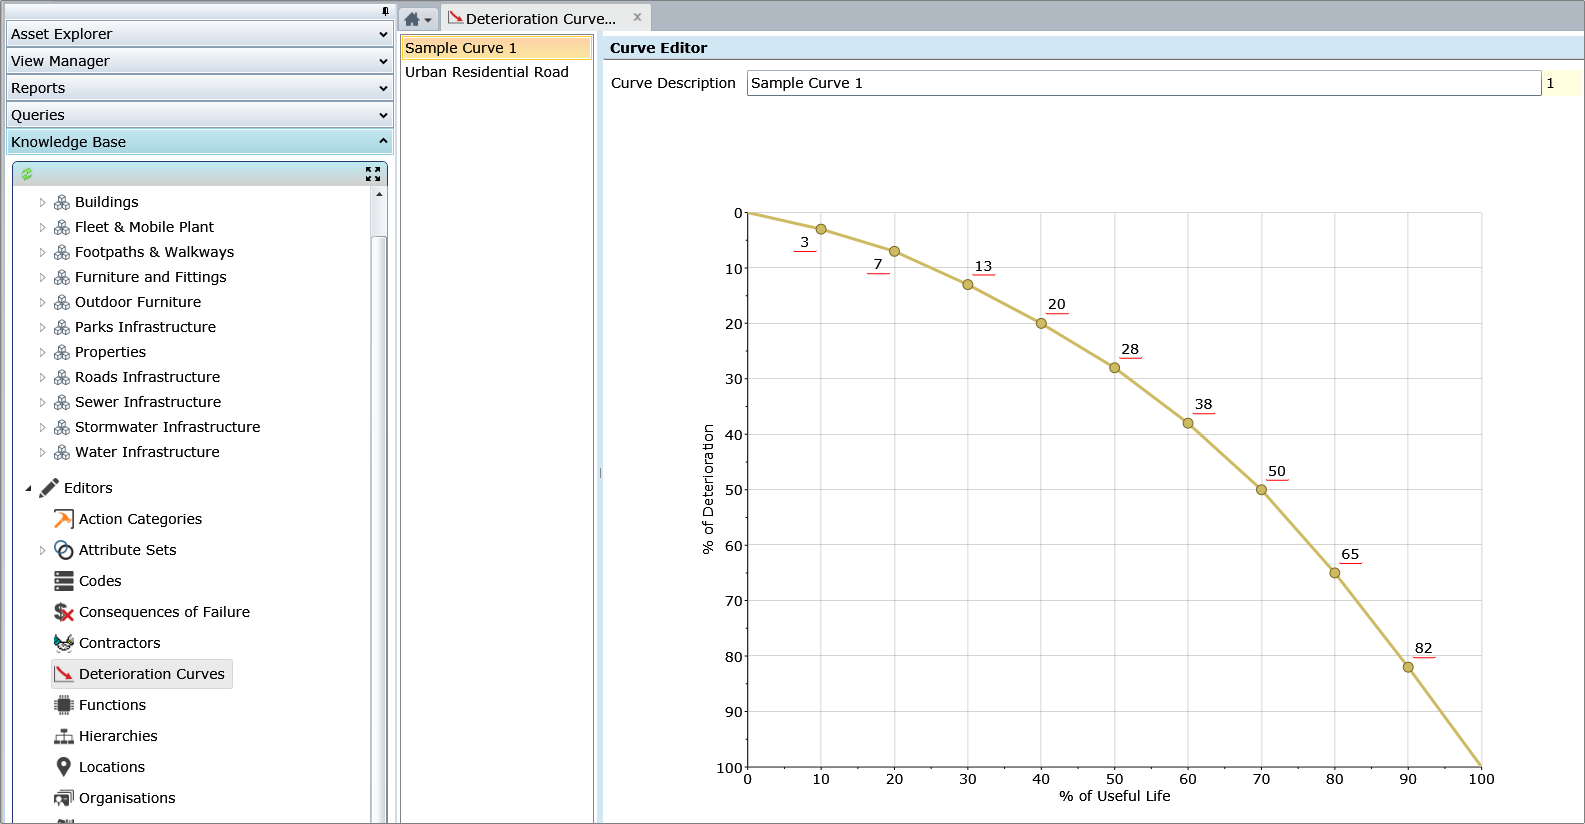
Open the Deterioration Curves Editor from the Knowledge Base panel, Editors section of the Navigation Window.
The X and Y axis of the chart are percentages:
•X for the Useful Life
•Y for Deterioration
•The nodes along the line represent the percentage of Deterioration expected at a point in time. Each percentage entered shapes the line to that point on the graph:
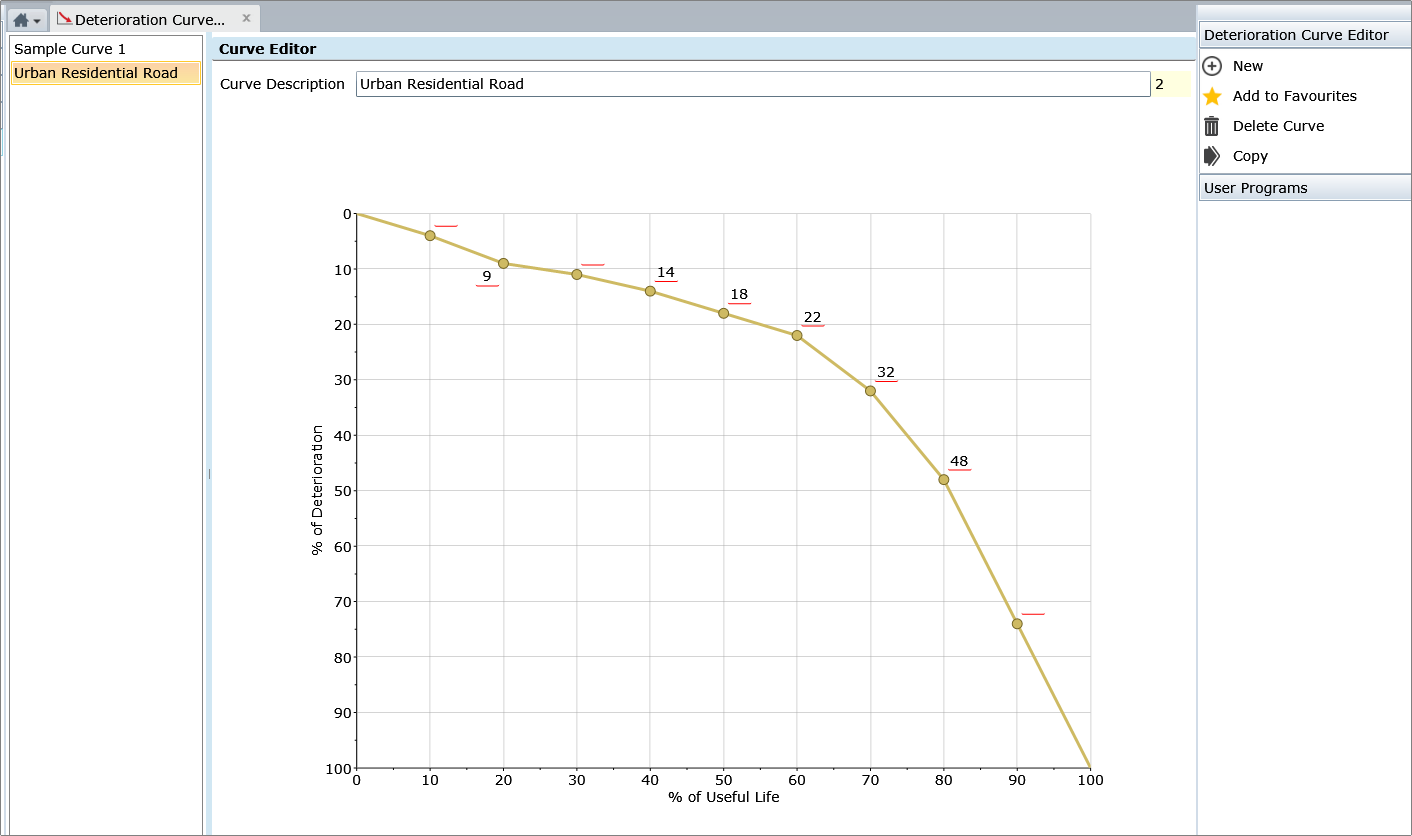
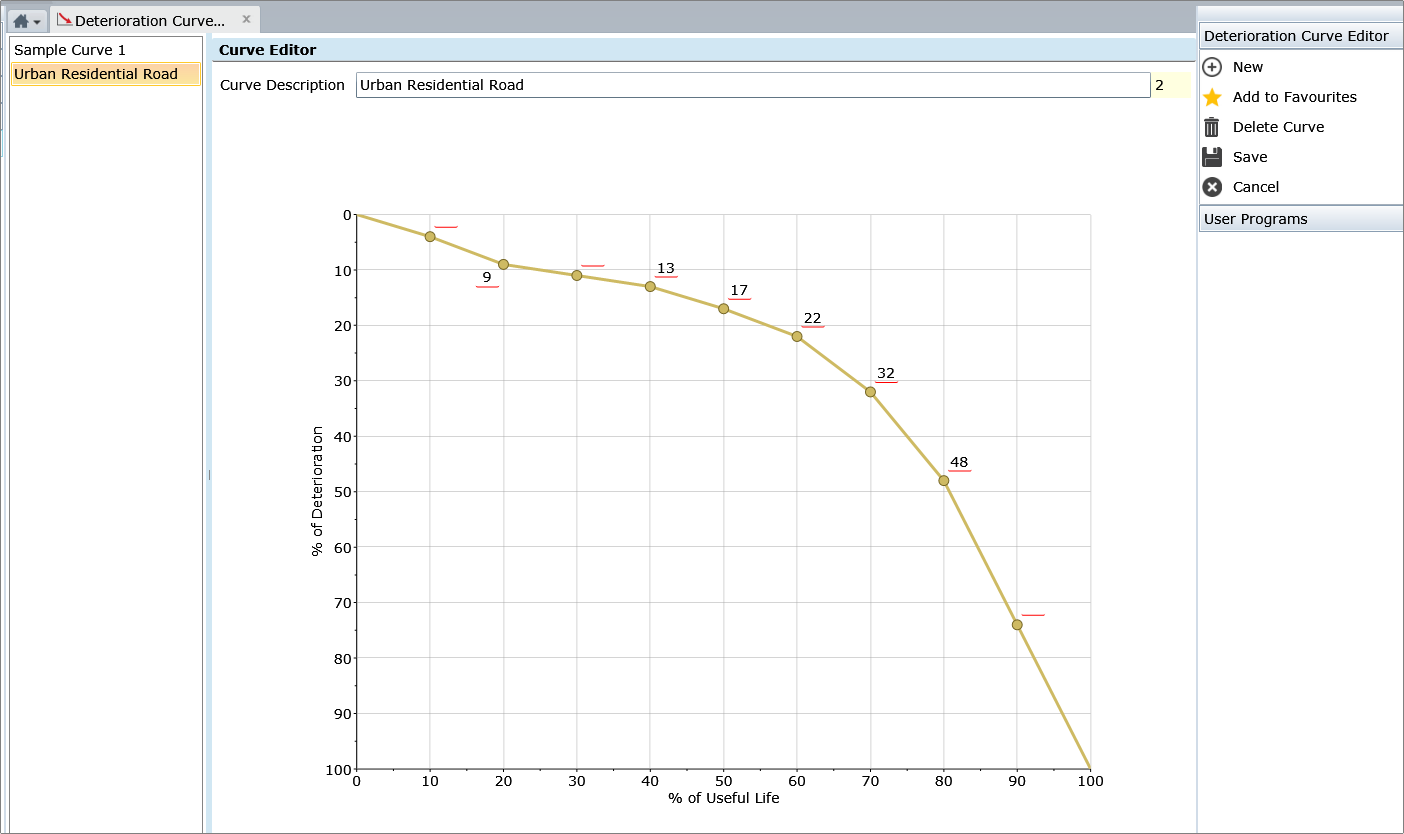
To change an existing Deterioration Curve, select its name in the list on the left of the Form. Changing either the Curve Name or any Deterioration value will put the Form into Edit Mode, making the ‘Save’ Task available:
•Set or change the Curve Name
•Set or change the Deterioration values, or…
•Instead of typing values, drag a node up or down to a new position
•Click ‘Save’ once the entered percentages correctly represent the Deterioration Curve for the Asset Type being modelled
•To Create a new Deterioration Curve either:
•Click the ‘New > Curve’ Task, or…
•Click the ‘Copy’ Task
•Name and model the Deterioration Curve as described above
A Deterioration Curve can be:
•Assigned to an Asset Type
•Selected from a Risk Event for Calculating the probability of the Risk Event occurring
NOTE: Deterioration Curves have no effect on Valuations and are not used in Depreciation calculations.