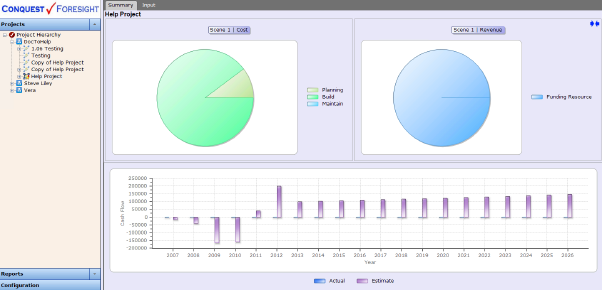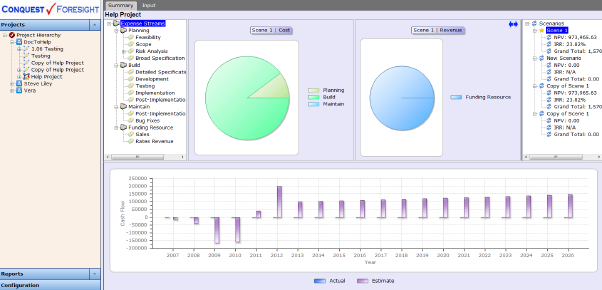
The Project Form opens for the selected Project in the Project Explorer. If the Project has a Preferred Scenario the Summary Tab is active, showing Pie Charts on Expense Stream values for each of; Cost and Revenue. The Pie charts can be used as follows:
•Clicking on a segment to expose the expense streams it contains (drill down)
•Clicking on an item of the Expense Stream Explorer to the left of the chart
•Clicking on an item of the Scenario list to the right of the chart
•Expanding the size of one or the other chart by sliding the window divider between them
•Expanding the size of both charts by clicking the double-headed arrow button to hide the Expense Stream and Scenario explorers.
Below the Pie Chart is a Cash Flow Histogram of side by side, Actual to Planned values over the periods of the project, for the current Scenario.